Business Analysis
PACKAGE 1 : Engaging business overview visualisations synthesis, including presentations package
PACKAGE 1 : Engaging business overview visualisations synthesis, including presentations package
We get a lot of words documents, powerpoint slides and are asked to make it better. Most of the discipline of doing comes from taking that information and expanding it in space.
For us, thinking visually is exercising our ability to gain understanding from the relationship between elements when they are laid out before us. You can see how this works in a short explainer video we made using the whiteboard animation.
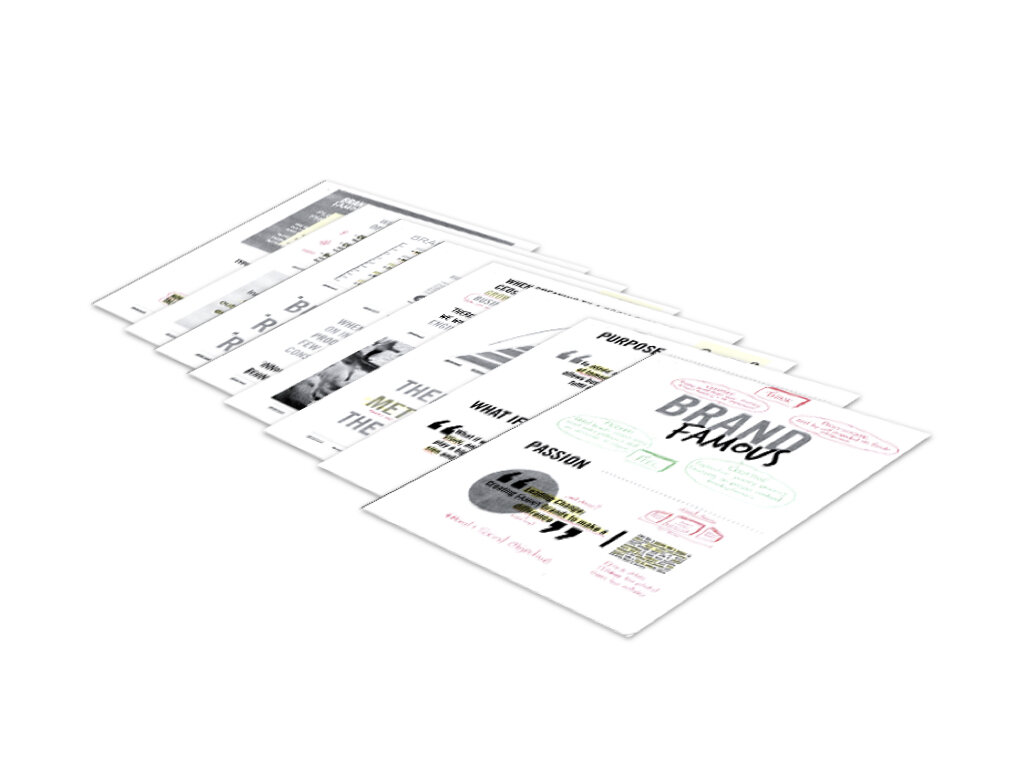
When working this way it is best to try and keep a balance between the logic of a piece and the stylistic realisation. We want it to be attractive and engaging but we also want it to make sense to the audience. The key for us is to try and build a map of relationships, a connected diagram to visualise the thought processes of the client. This is how we create our Visualisations and hopefully you can see how useful a tool this can be to really land your messages with your audiences.
Project/Business communications package designed around engagement & collaboration

Project/Business communications package designed around engagement & collaboration

Project/Business communications package designed around engagement & collaboration
“Dan’s unique synthesis distilled the 56 pages of almost impenetrable text into three unambiguous diagrams. The visualisations have had a positive impact on our internal communication and improved our common understanding”
